US Presidential Elections from 2000 to 2020
Interactive Dashboard with Highcharts graphics on Shiny server
This interactive dashboard showcases the features and functionalities that can be achieved using Highcharts and Shiny. It was developed in R with RStudio. Animations are supported by custom JavaScript
Videos
Interactive Dashboard Overview
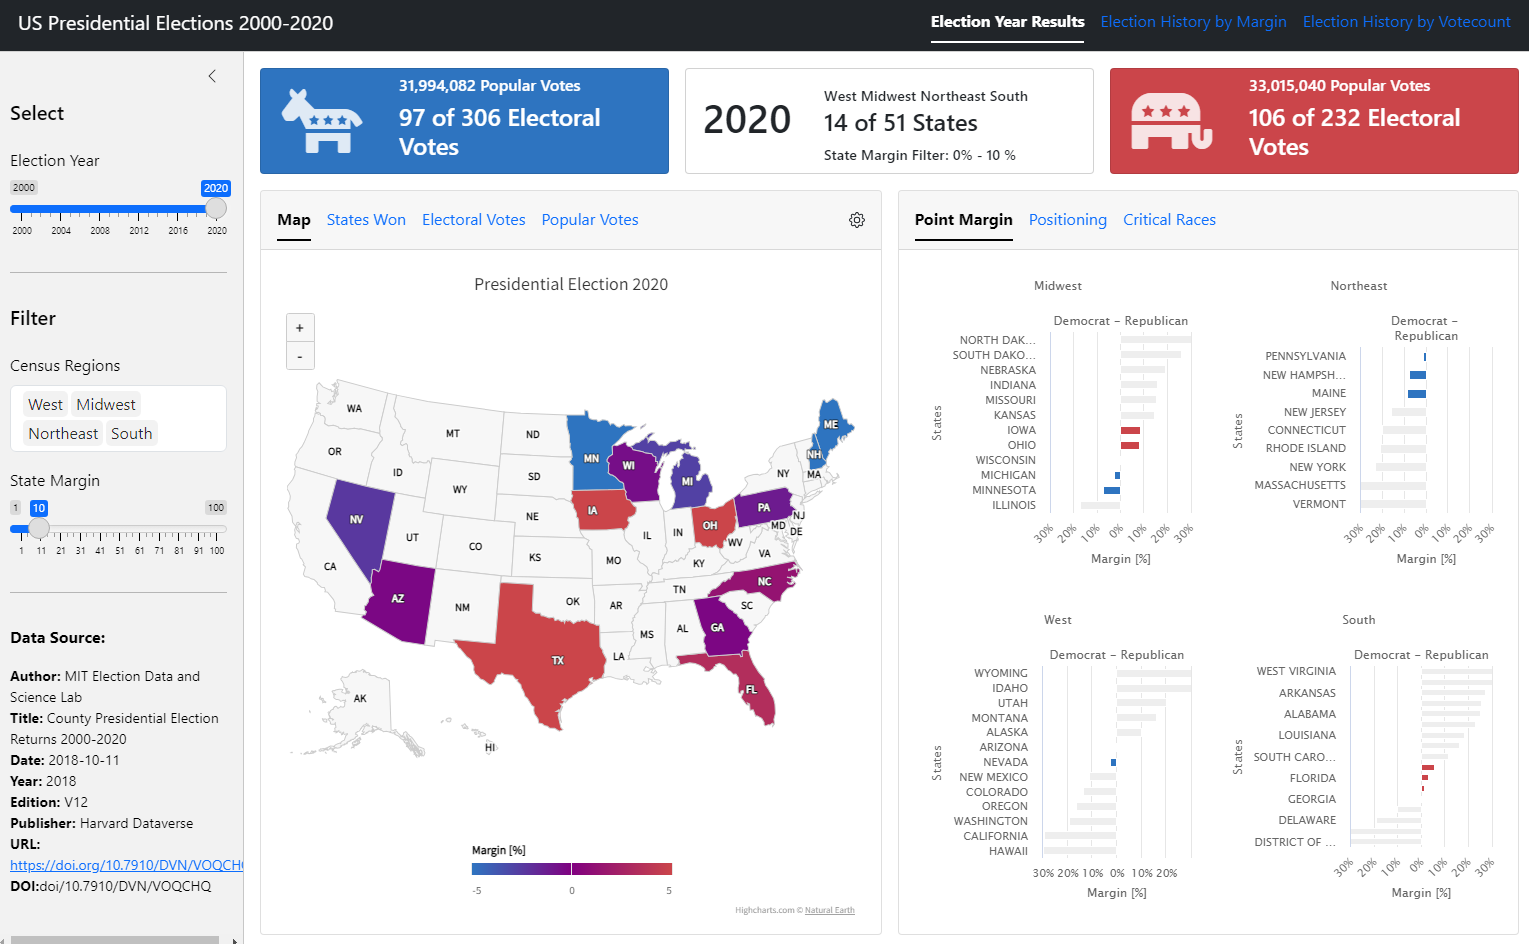
Select Election Year and Filter by Census Region
Critical Races Filter by Winning Margin
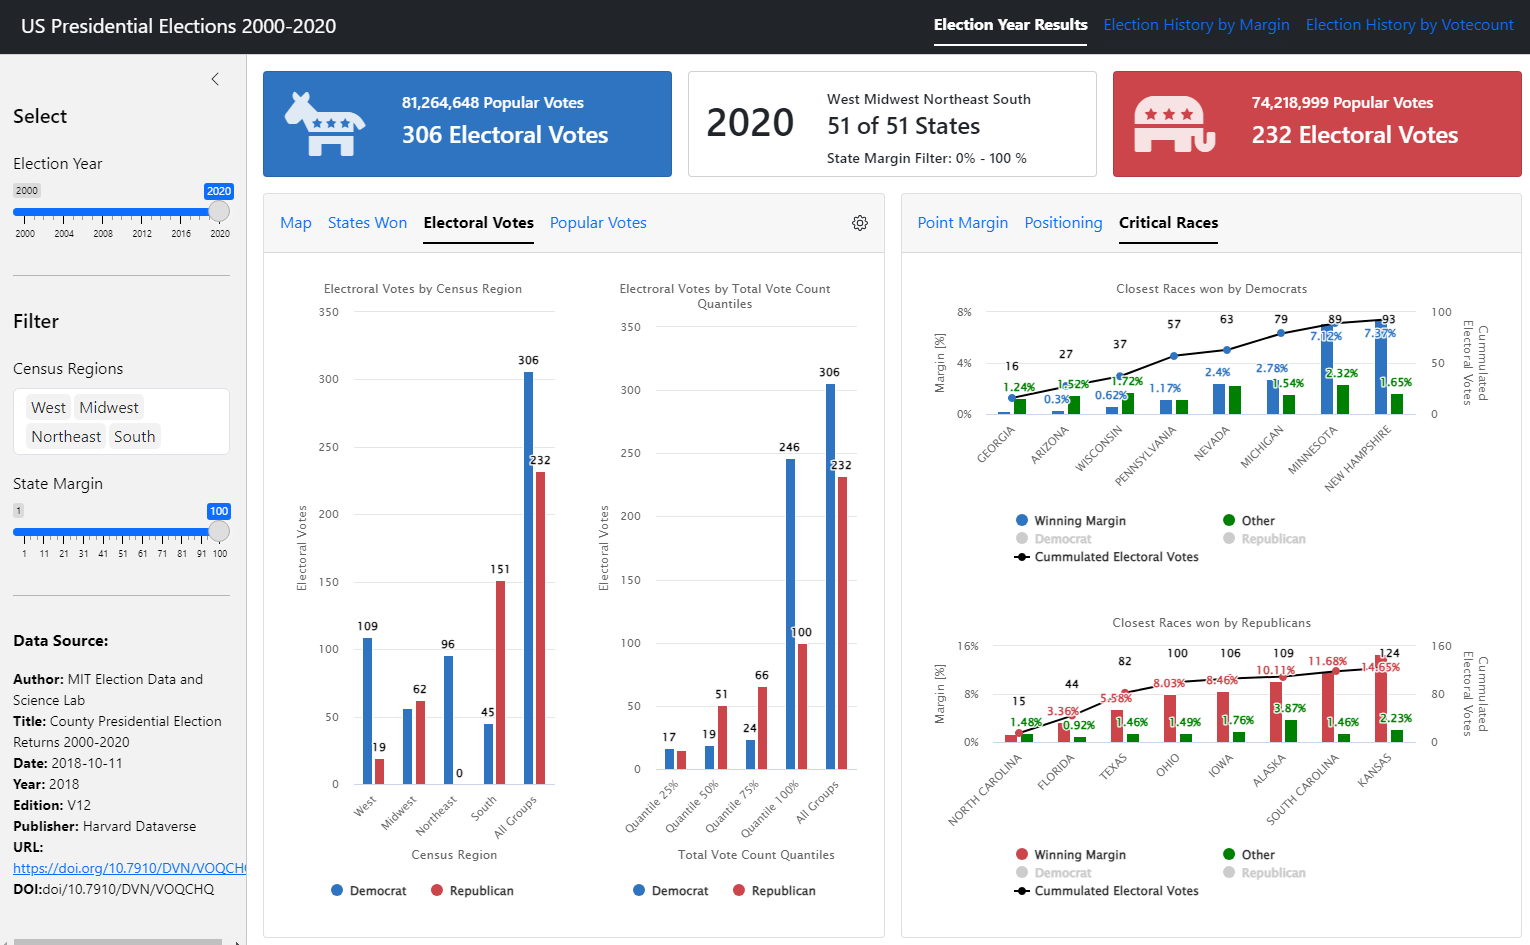
Screenshots
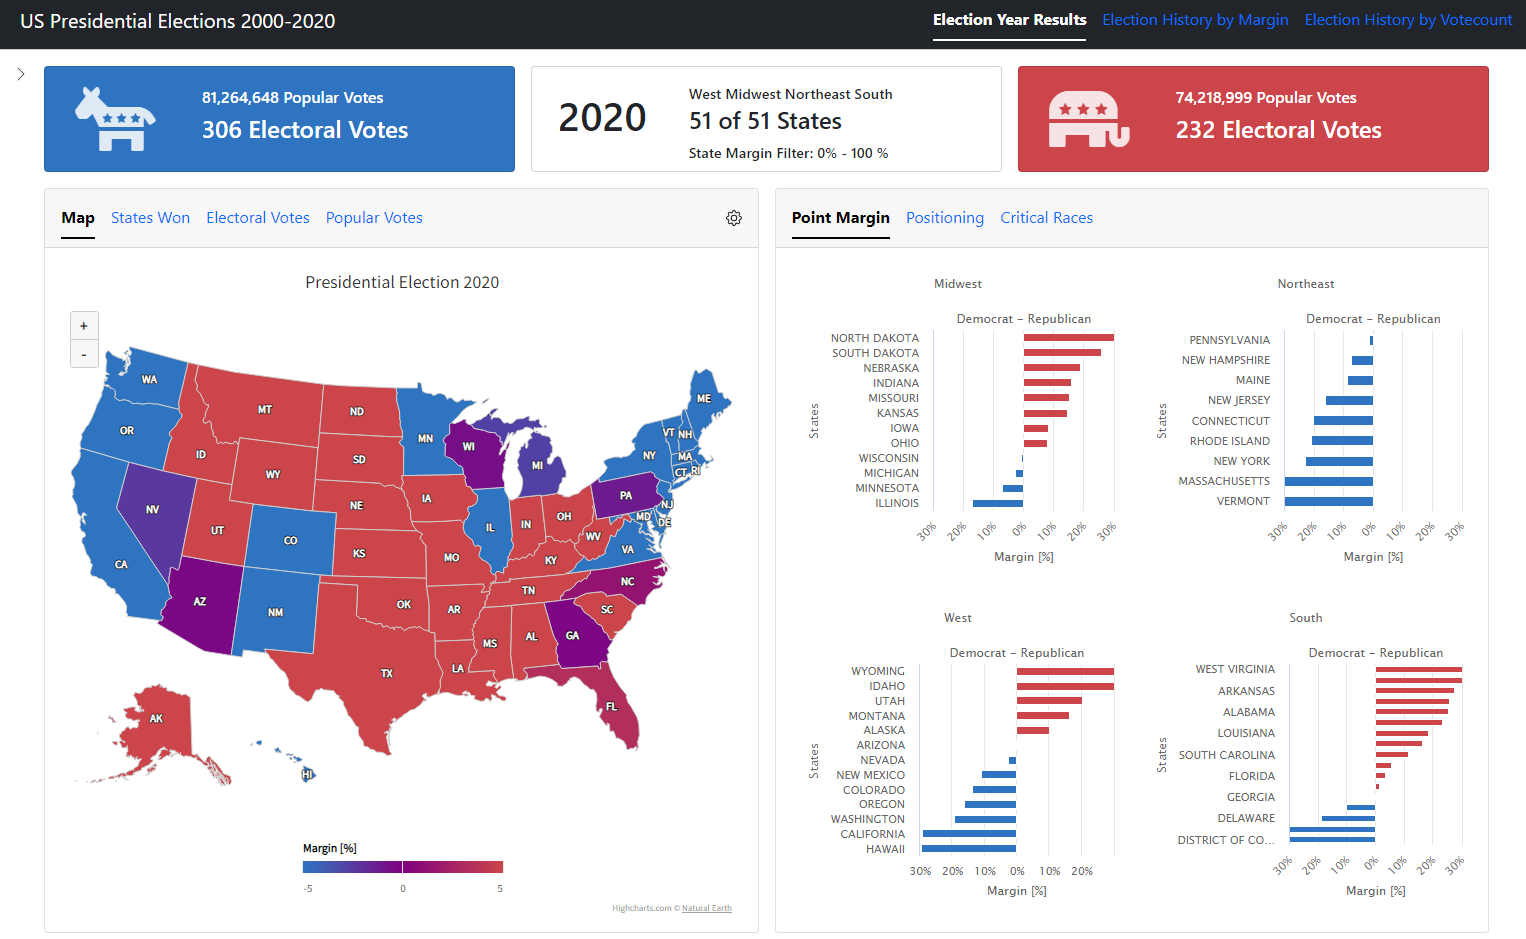
Filter by margin and census region
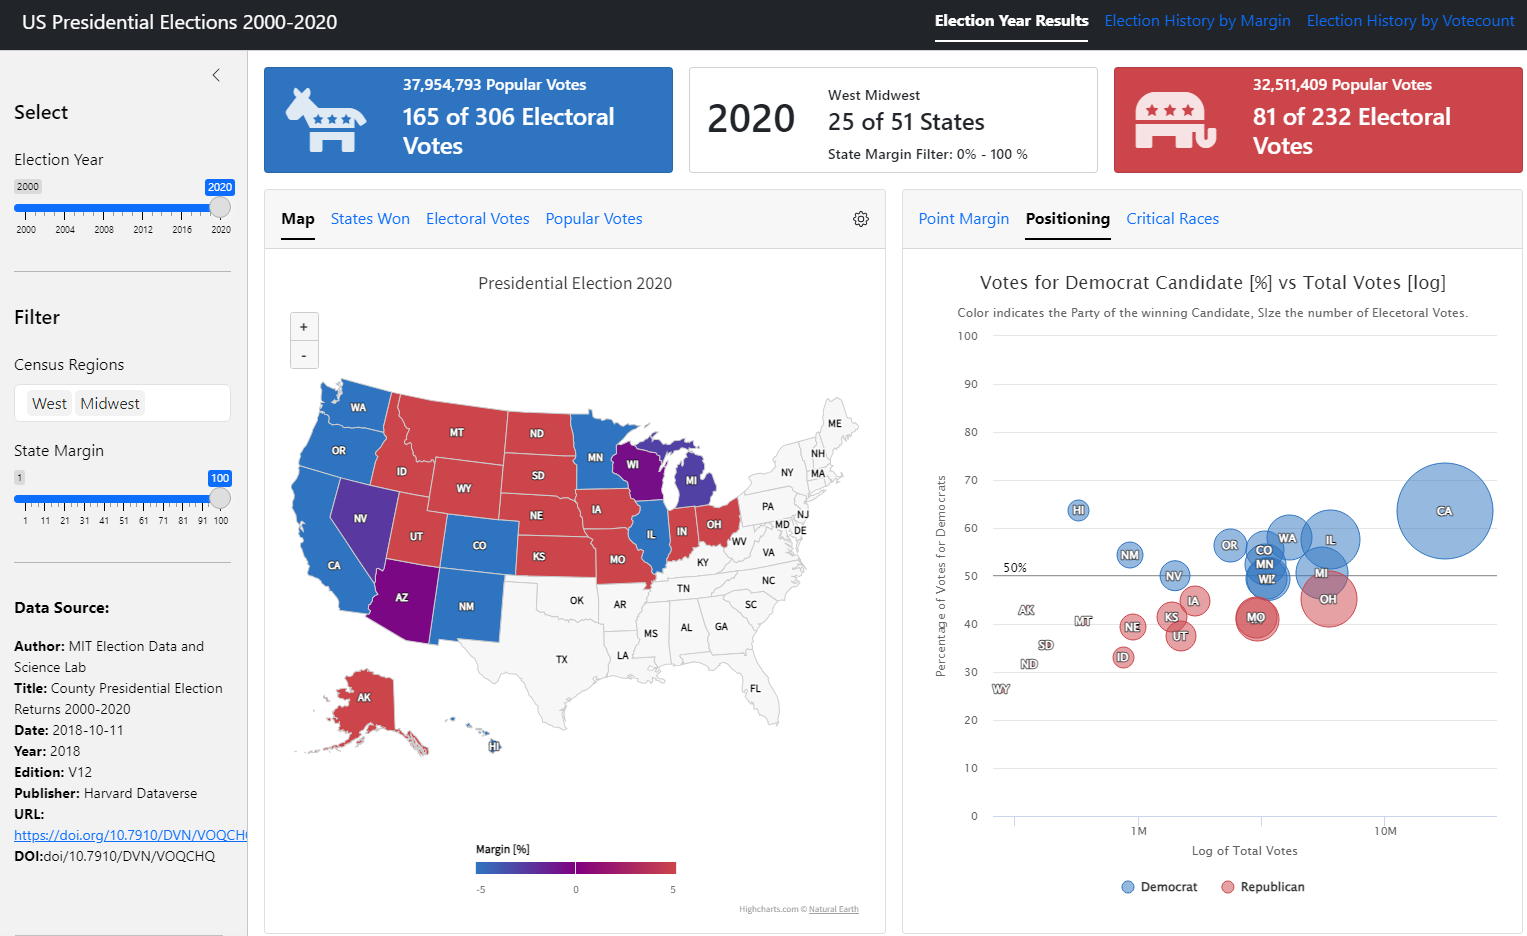
Analyze the relative size of the states versus the result
See the critical races and the influences of third party candidates
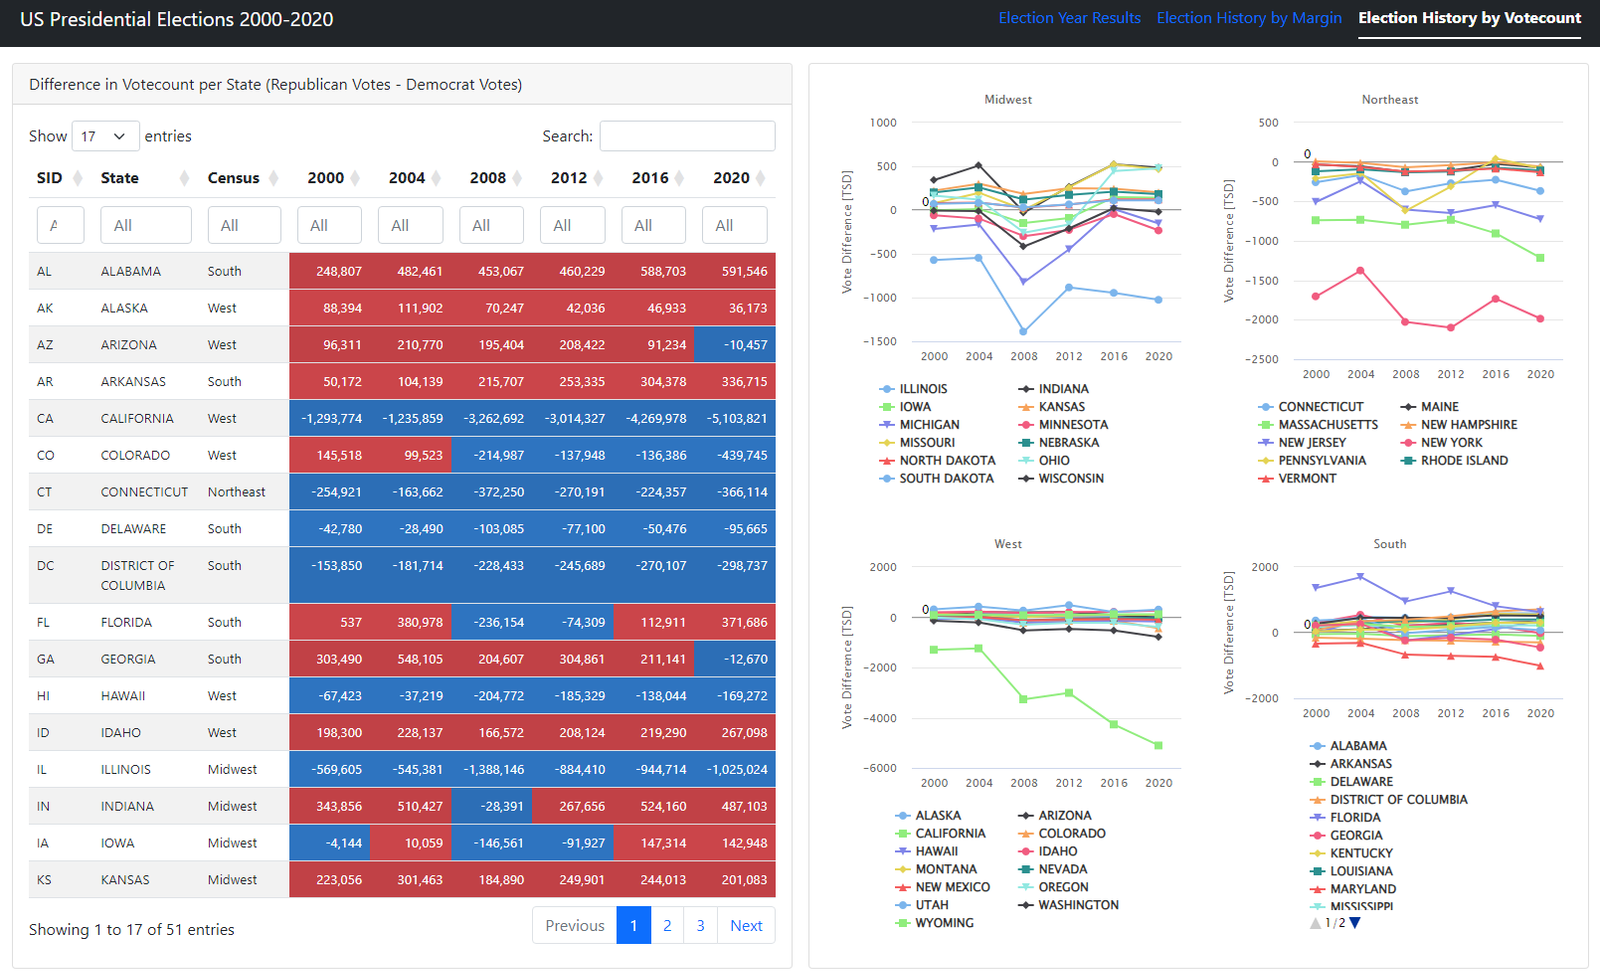
Margin Time Series for the Presidential Elections from 2000 to 2020